With contributions from Owi Ruivivar, Chief Portfolio Strategist; Eli Lee, Chief Investment Strategist; Mansoor Mohi-Uddin, Chief Macro Strategist; Low Pei Han, CFA, Head of Equity Strategy; Boh Hui Ling, CFA, CESGA, Head of Fixed Income Strategy; Neo Bee Leng, Senior Investment Strategist
Limits of traditional hedges
Oil supply risk is now the centre of market attention. Disruptions to energy production and trade routes are already feeding into inflation and costs, with direct consequences for portfolios.
Oil supply shocks represent an exogenous type of market disruption that originate outside the financial system. Oil prices are transmitted directly through energy prices and costs, and impact depends on how these pressures interact with growth and policy.
This distinction matters for hedging portfolios. Assets commonly viewed as defensive may not provide uniform protection across different environments, and their effectiveness depends on the nature of the shock.
For portfolio construction, this raises two related questions: what characteristics define an effective hedge in this context, and which assets exhibit those characteristics in practice.
This paper by the CIO Investment Institute examines historical oil supply disruptions to address these questions, assessing how asset classes behave in this environment and implications for portfolio construction. This provides a framework for identifying suitable portfolio hedges in a volatile market environment while staying invested. In essence, maintaining a diversified portfolio remains a key priority for long-term portfolio resilience.
Oil shocks in historical context
We review a set of historical oil supply shocks, focusing on the nature of the disruption and the macroeconomic backdrop in each episode.
Oil markets have repeatedly served as the transmission channel through which geopolitical tensions affect the global economy. Production and transportation remain geographically concentrated, so disruptions in key regions can translate quickly into constraints on global supply and sharp movements in energy prices.
Over the past five decades, several such episodes have occurred, including the 1973 Arab oil embargo, the 1979 Iranian revolution, the 1990 Gulf War, the 2003 Iraq War, the 2011 Libyan civil war, the 2018 US sanctions on Iran, and the 2022 Russia–Ukraine war. While the geopolitical circumstances differ, each episode was characterised by a sudden or anticipated disruption to global oil supply.
While some events involved abrupt and large-scale supply disruptions, others unfolded gradually as uncertainty around production or transportation increased. In certain cases, spare capacity or alternative supply channels helped offset the initial shock, while in others, constraints persist for longer. The timing of the disruption relative to the economic cycle also varied, occurring in late-cycle environments or during periods of recovery.
The prevailing inflation and policy making backdrop varied across episodes. The oil shocks of the 1970s took place in an environment of already elevated inflation and less constrained policy, while later episodes unfolded in periods of lower inflation and more established monetary frameworks.
Exhibit 1 places these events in historical context, highlighting the evolution of oil prices alongside the major supply shock episodes. In many cases, prices begin to move ahead of the formal trigger as geopolitical tensions build, before stabilising or partially reversing as supply adjusts.
Exhibit 2 summarises the key characteristics of each episode, including the escalation phase, the geopolitical trigger, the nature of the market disruption, the scale of supply affected and the global economic backdrop at the time of the shock. The variation across these dimensions highlights the diversity of oil supply shocks in both magnitude and context.
The current Iran episode fits within this historical pattern. As in earlier cases, the escalation has centred on disruptions to energy infrastructure and trade routes, with the potential to constrain global supply. The backdrop remains one of persistent inflation pressures alongside slowing, but not yet contracting, global growth.
Exhibit 1: Oil prices and major supply shock episodes
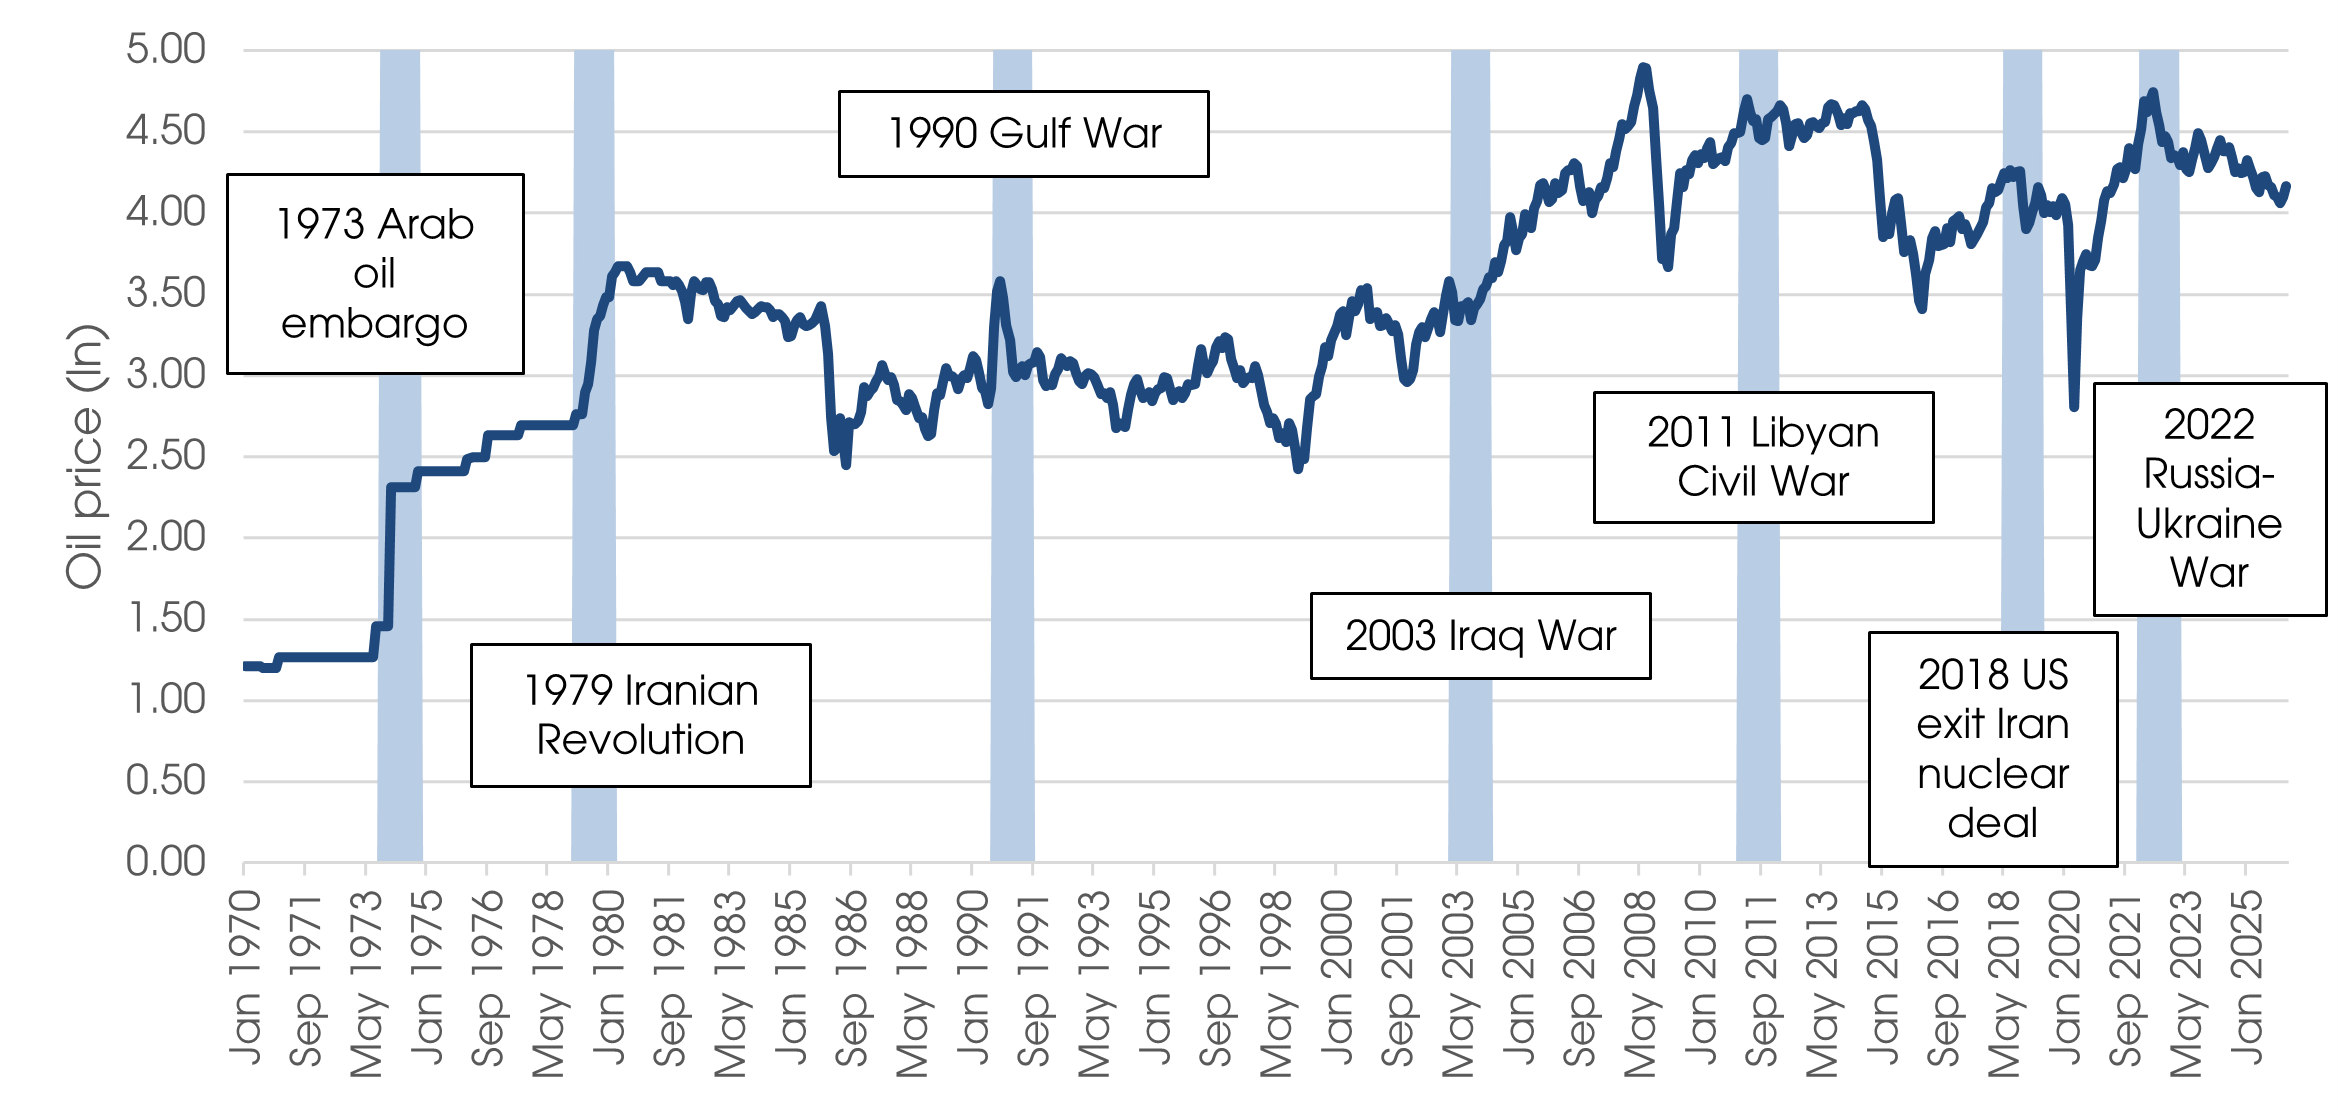
Source: Bank of Singapore
Exhibit 2: Oil supply shocks - Event characteristics and market outcomes
|
3m asset returns after shock |
Summary macro and valuations |
|||||||||
|
Event |
Escalation phase (tensions rising, oil begins moving) |
Geopolitical trigger (invasion, embargo, revolution, policy announcement) |
Market disruption (t = 0, and type) |
Lost supply (share of world) |
Global economic backdrop |
Oil price return (3m, in %) |
S&P 500 return |
Inflation regime entering shock |
Policy stance entering shock |
Equity valuation (CAPE) |
|
Arab oil embargo |
Arab–Israeli tensions rise ahead of the Yom Kippur War; oil markets tighten as geopolitical risks increase. |
Arab OPEC members impose an oil embargo on the US and several Western countries following the October 1973 war. |
October 1973 – Coordinated export embargo and production cuts by Arab oil producers. |
Roughly 7–9% of world supply |
Inflation already rising across advanced economies, with monetary policy tightening but still lagging inflation pressures. |
134.6 |
-10.8 |
High and rising |
Tight and hiking |
Fair |
|
Iranian Revolution |
Political unrest and oil worker strikes disrupt Iranian production during late 1978 as the Shah’s regime weakens. |
Collapse of the Iranian government and establishment of the Islamic Republic following the February 1979 revolution. |
February 1979 – Sharp collapse in Iranian oil production and exports. |
Iran output down about 4.8 mb/d, net global loss |
Late-cycle expansion with already elevated inflation and increasingly restrictive monetary policy. |
14.2 |
2.9 |
High and rising |
Tight and hiking |
Cheap |
|
Gulf War |
Rising tensions between Iraq and Kuwait during mid-1990 amid disputes over oil production quotas and debt. |
Iraq invades Kuwait in August 1990, removing significant oil supply from global markets. |
August 1990 – Sudden loss of Iraqi and Kuwaiti oil exports. |
About 4.3 mb/d of Iraqi + Kuwaiti output taken offline at peak, about 6% of world supply |
Global growth slowing after the late-1980s expansion, with moderate inflation and tightening monetary policy. |
18.9 |
-0.1 |
High but stable |
Tight but easing |
Fair |
|
Iraq War |
Military buildup and escalating tensions between the US and Iraq through late 2002 and early 2003. |
US-led coalition launches invasion of Iraq in March 2003. |
March 2003 – War-related disruption risk to Middle East oil production. |
<2% of world supply |
Early-cycle recovery following the dot-com recession with low inflation and highly accommodative monetary policy. |
-8.4 |
14.9 |
Low but rising |
Loose and easing |
Fair |
|
Libyan civil war |
Arab Spring protests spread across North Africa in early 2011, raising risks to Libyan oil production. |
Civil war breaks out in Libya and removes a large share of light crude exports from global markets. |
February 2011 – Collapse in Libyan oil production and exports. |
About 2% of world crude |
Post-global financial crisis recovery with subdued inflation and extremely accommodative monetary policy. |
13.1 |
1.4 |
Low and stable |
Very accommodative |
Rich |
|
US exit from Iran nuclear deal |
Rising geopolitical tensions between the US and Iran during early 2018 amid debate over sanctions. |
US withdraws from the Joint Comprehensive Plan of Action (JCPOA) and reimposes sanctions on Iranian oil exports. |
May 2018 – Sanctions-driven decline in Iranian oil exports. |
Roughly 1–2% of world supply |
Late-cycle global expansion with moderate inflation and gradual monetary policy tightening in the US. |
-2.7 |
7.3 |
Low and stable |
Loose but hiking |
Very rich |
|
Russia–Ukraine War |
Large Russian troop buildup near Ukraine through late 2021 and early 2022 raises concerns over sanctions and energy supply. |
Russia launches a full-scale invasion of Ukraine in February 2022. |
February 2022 – Sanctions and trade disruptions affecting Russian energy exports. |
2–3% of world supply depending on sanctions and rerouting |
Global economy emerging from the pandemic with already elevated inflation and the start of aggressive monetary tightening. |
19.5 |
-5.5 |
Low but surging |
Very accommodative |
Extremely rich |
|
Median (event sample) |
14.2 |
1.4 |
||||||||
|
Average (event sample) |
27.0 |
1.4 |
||||||||
|
Unconditional long-run average |
|
|
|
|
11.6 |
9.4 |
|
|
|
|
|
Iran 2026 |
Escalating tensions between Iran, Israel, and the US during early 2026 with rising attacks on energy infrastructure and shipping. |
US-Israeli strikes on Iranian targets followed by Iranian retaliation and threats to shipping in the Strait of Hormuz. |
March 2026 – Effective closure of the Strait of Hormuz and disruption to Gulf energy exports. |
Roughly 3-5% of world supply initially disrupted; up to ~20% of global oil trade exposed via Hormuz |
Late-cycle global economy with persistent inflation pressures following the post-pandemic tightening cycle. |
- |
- |
Moderate but persistent |
Tight but easing |
Extremely rich |
Source: Bank of Singapore Note: Market disruption (t=0) denotes the month in which the supply shock became visible in oil prices. Returns show cumulative performance over the following 3 months.
Market behaviour around oil supply shocks
To examine how markets respond to oil supply disruptions, we analyse the behaviour of oil prices and equity markets in the 12 months before and after each of the seven episodes described above.
Exhibit 3 shows the evolution of oil prices around each episode, indexed to the month of the geopolitical trigger. Three features stand out.
(i) Oil prices often begin to rise ahead of the formal event date. In many cases, geopolitical tensions build gradually, and markets incorporate the risk of supply disruption before the trigger occurs. This pattern is visible across several episodes and is reflected in the upward drift in the median price path prior to the shock.
(ii) The magnitude of price movements varies across episodes. Some shocks result in sharp and immediate increases in oil prices, while others lead to more moderate or gradual rises. The scale of the response reflects both the size of the disruption and prevailing supply conditions.
(iii) Oil prices often stabilise or partially reverse in the months following the initial shock. As the disruption becomes clearer and supply adjusts, markets reassess the balance between supply and demand.
Exhibit 4 compares these dynamics with the behaviour of equity markets. In contrast to oil prices, equity responses are more varied across episodes. In some cases, equities decline around the time of the shock, while in others the impact is more limited or short-lived. The median path suggests a modest decline around the event followed by a gradual recovery over time.
Taken together, these results highlight differences in how energy and equity markets respond to oil supply disruptions. Oil prices reflect the direct impact of changes in supply, while broader financial market responses vary across episodes.
Exhibit 3: Oil prices around oil supply shocks (t-12 to t+12)
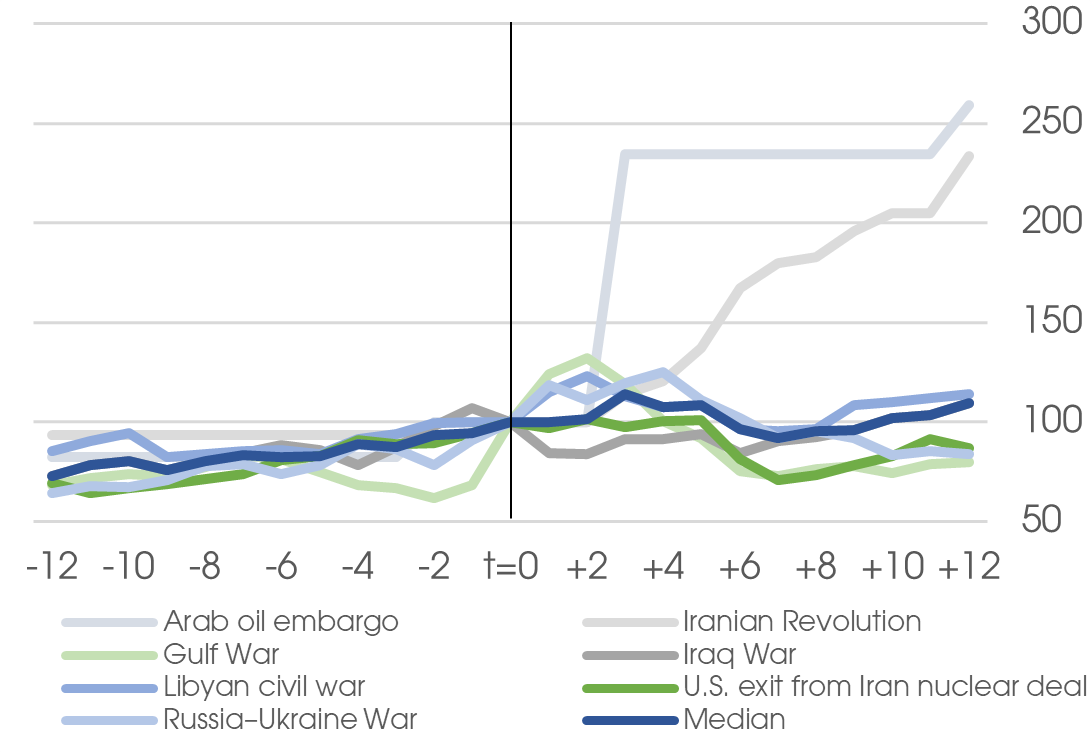
Source: Bank of Singapore
Exhibit 4: Equity prices around oil supply shocks (t-12 to t+12)
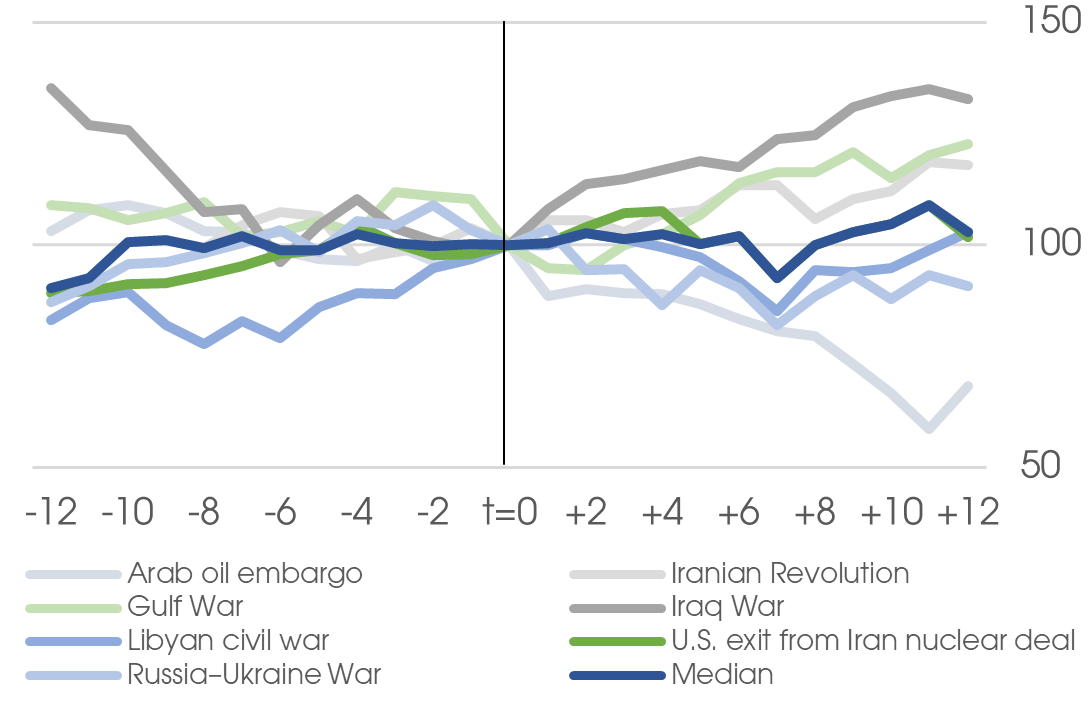
Source: Bank of Singapore
Exhibit 5: Select asset class returns and VIX 12 months after oil supply shocks
|
Event |
S&P 500 |
Oil (WTI) |
Gold |
UST |
USD |
JPY |
CHF |
SGD |
VIX |
|
Arab oil embargo |
-31.8 |
158.9 |
58.7 |
- |
6.5 |
-11.0 |
8.0 |
- |
- |
|
Iranian Revolution |
18.1 |
133.4 |
153.5 |
- |
-0.6 |
-19.5 |
-1.7 |
- |
- |
|
Gulf War |
22.6 |
-20.2 |
-10.4 |
13.5 |
8.0 |
5.2 |
-14.4 |
2.6 |
-51.6 |
|
Iraq War |
32.8 |
9.6 |
26.4 |
4.6 |
-11.4 |
13.3 |
6.8 |
5.3 |
-42.6 |
|
Libyan civil war |
2.9 |
14.1 |
20.2 |
9.7 |
2.4 |
0.8 |
2.7 |
1.6 |
0.4 |
|
US exits from Iran nuclear deal |
1.7 |
-13.1 |
0.5 |
6.5 |
4.0 |
0.5 |
-1.5 |
-2.6 |
21.3 |
|
Russia–Ukraine War |
-9.2 |
-16.2 |
-4.3 |
-9.8 |
8.4 |
-15.6 |
-2.7 |
0.5 |
-31.3 |
|
Median return |
2.9 |
9.6 |
20.2 |
6.5 |
4.0 |
0.5 |
-1.5 |
1.6 |
-31.3 |
|
Average return |
5.3 |
38.1 |
34.9 |
4.9 |
2.5 |
-3.8 |
-0.4 |
1.5 |
-20.8 |
|
Unconditional Average historical return |
9.4 |
11.6 |
11.5 |
5.2 |
0.0 |
2.3 |
3.7 |
1.1 |
6.6 |
|
Event average - Historical average |
-4.2 |
26.5 |
23.4 |
-0.3 |
2.4 |
-6.0 |
-4.1 |
0.4 |
-27.4 |
Source: Bank of Singapore
Performance of traditional hedge assets after oil supply shocks
The preceding analysis examines how oil prices and equity markets behaved around historical supply disruptions. A natural question for investors is whether assets traditionally viewed as portfolio hedges provided protection in the aftermath of these events.
To address this question, Exhibit 5 presents the results of a simple event study. For each asset class, we compute the return in the 12 months following each of the seven oil supply shocks identified earlier. The exhibit reports both the mean and median outcome across episodes, alongside unconditional returns over the full sample period. Considering both measures of central tendency is useful given the limited number of historical events and the potential for individual episodes to exert a disproportionate influence on the average.
The results reveal several clear patterns.
Characteristics of effective hedges
For portfolio construction, we cannot presume the effectiveness of hedges based on conventional labels such as “safe haven” status. Instead, effective hedges tend to be those whose payoff is directly linked to the source of the disruption. In other words, hedges that respond directly to the source of the disruption tend to perform more reliably than those that depend on secondary financial market dynamics.
From a whole portfolio perspective, a hedge candidate should provide reliable downside protection during tail risk events. Ideally, portfolio hedges should exhibit low or negative correlation to core exposures, helping to reduce overall portfolio volatility and concentration risk. In addition to these diversification benefits, suitable hedges should have strong liquidity characteristics, transparent risk drivers, and cost efficiency to ensure they are implementable.
Furthermore, their characteristics should demonstrate robustness across varying market regimes. Ultimately, it should strengthen portfolio resilience, limit drawdown severity during periods of stress and enhance risk-adjusted returns while preserving long-term capital compounding.
Candidates for a portfolio hedge
The historical evidence provides a useful guide, but the question is how to translate it into portfolio construction.
In practice, this means identifying where protection is reliable, where it is conditional on the macro environment, and how different exposures interact when oil-driven shocks unfold.
The discussion below applies these insights across fixed income, equities, currencies and alternatives, with a focus on how they can be combined to improve portfolio resilience.
Equities
Equity performance following oil supply shocks is uneven but can be improved through sector allocation and quality tilts.
Across the historical episodes examined, US large cap stocks have generally outperformed US small caps, Europe, Japan, and Emerging Markets (EM) equities.
At the sector level, the dispersion is pronounced. Energy stocks, especially of upstream producers, have unsurprisingly outperformed, while materials performed relatively well, particularly within EM equities. By contrast, sectors with greater sensitivity to consumer demand or input costs, such as financials and consumer discretionary have tended to lag in the US, while industrials and consumer discretionary in EM. These sectors contain the industry groups of retailing, transport and autos. In a risk-off environment, investors also tend to gravitate to more defensive sectors such as utilities, consumer staples and healthcare which generally have a lower beta and more stable earnings profiles.
When oil shocks persist and energy prices remain elevated, the importance of quality becomes more pronounced. Higher energy costs feed through into broader inflation pressures and slower growth, creating a more challenging operating environment. Companies with strong balance sheets, pricing power and the ability to self-fund operations are better positioned to absorb these pressures.
Characteristics such as sustainable competitive advantages, pricing power (ability to pass on inflationary costs), strong financial health (able to self-fund operations when external financing becomes expensive, or even undertake acquisitions), resilient earnings, and strong free cashflows, help mitigate volatility and support performance during periods of stress. Importantly, such companies are not confined to traditional defensive sectors but can be identified across the equity universe through a focus on fundamentals.
More broadly, the current environment also reinforces a structural shift toward sectors linked to security and resilience, including energy, minerals, defence, food and infrastructure. In these areas, long-term contracts (often with government counterparties) support demand even as broader economic conditions weaken.
Fixed Income
Fixed income provides conditional protection, with outcomes largely determined by the inflation or growth dynamics associated with the oil shock.
During oil shocks, risk aversion rises and capital shifts toward higher-quality assets. Dispersion increases, with High Yield (HY) rated bonds experiencing more significant spread widening compared to Investment Grade (IG) bonds. Issuers with weaker fundamentals and greater dependence on external financing are likely to see larger spread widening as geopolitical risk premia rise. Maintaining a focus on high-quality, defensive credits helps mitigate downside risk in this environment.
Government bonds provide uneven protection. As noted earlier, they have historically been more effective at hedging against growth shocks than inflation shocks, which limits their reliability as a safeguard during energy-driven disruptions. In such situations, Treasury Inflation-Protected Securities (TIPS) tend to provide better protection against rising inflation compared to regular Treasury bonds.
During the current oil shock, the UST yield curve has bear-flattened month-to-date (MTD) as markets have lowered expectations for Federal Reserve (Fed) rate cuts amid concerns about potentially higher inflation. This has resulted in TIPS outperforming USTs MTD.
When inflation concerns outweigh growth worries, longer-duration assets generally underperform. Therefore, positioning portfolios in the short end of the yield curve typically offers better protection at the onset of oil shocks.
At the same time, extended energy disruptions raise the risks of stagflation, higher unemployment and sluggish economic growth. This may eventually lead the Fed to switch its focus and ease policy at a later stage. Reflecting these opposing forces, we remain Neutral on duration at the portfolio level.
At the sector level, defensive sectors such as telecom and consumer staples as well as energy geared sectors such as upstream oil & gas, commodity players and energy exporters, tend to be more resilient. In contrast, energy importers, downstream refiners, petrochemicals as well as cyclical sectors – such as ports, real estate, shipping, airlines, autos and consumer discretionary – are more likely to be negatively impacted.
As for utilities, the impact largely depends on how quickly higher fuel costs can be passed on to consumers. In some countries, particularly EMs, price controls may be in place to mitigate the inflationary effects on the broader economy.
Even among those who benefit, gains are unlikely to be uniform. For instance, in the upstream segment, factors such as whether sales volumes are priced at fixed rates or spot prices, the location of assets and the extent of oil production hedging will influence how much advantage a producer would be able to realise.
For bond prices, market technicals, risk sentiment, and interest rate fluctuations will all impact the total returns for investors. Clearly, the recent positive correlation between oil prices and rate volatility is expected to further complicate credit markets, leading to higher risk premiums and increased spread volatility.
Currencies and Gold
Traditionally, the USD, JPY and CHF have been favoured by investors – with the SGD a more recent alternative – when looking to currencies to hedge portfolios during times of risk aversion. The USD benefits from safe haven-seeking inflows into UST while the JPY, CHF and SGD benefit from Japan’s, Switzerland’s and Singapore’s large current account surpluses. The latter drive exchange rates higher during times of risk aversion when investors become fearful and capital account flows dry up.
But as the historical track record given in the first section of this paper shows, the performance of each safe haven currency has varied during the different oil shocks seen since the early 1970s.
In the current oil shock, following the joint US-Israeli attacks on Iran from 28 February, the USD has so far been the stand-out currency; appreciating against the JPY, CHF, SGD and even gold during the conflict.
The greenback has strengthened for two reasons. First, the US has become relatively self-sufficient in energy production over the last decade due to the shale oil revolution. In contrast, Europe and Asian countries remain significant net oil and gas importers. Thus, higher energy prices benefit US producers while hurting energy-importing economies in the rest of the world. Second, the risk that surging oil prices cause inflation to rise again in 2026 has made it less likely the Fed will cut interest rates further over the next few months.
By comparison, the JPY has weakened close to four-decade lows against the USD around 159, the CHF and SGD have dipped towards 0.79 and 1.28 versus the greenback and gold, a zero-yielding asset, is trading near USD5,000/oz having hit new all-time highs of USD5,600/oz earlier this year.
But while the JPY may continue to be undermined by surging oil prices, we think the current strength of the USD is likely to be fleeting and therefore would favour the CHF, SGD and gold as longer-term safe haven hedges.
In particular, if the war in the Persian Gulf lasts beyond a few weeks and oil prices exceeding USD100/bbl cause the major economies to suffer stagflation and rising unemployment then the Fed is likely to switch from focusing on inflation in the next few months to cutting interest rates instead to ward off recession.
In addition, the Trump administration’s volatile policies are likely to spur global investors to keep diversifying their portfolios away from US markets over the next few years. Such diversification helped push the USD down 10% against a range of currencies in 2025 and we expect similar declines are likely each year if the Trump administration continues to shock financial markets.
Investors could consider CHF, SGD and gold as safe haven assets to hedge their portfolios during the current oil shock despite the greenback’s initial strength at the start of the war.
Liquid Macro Hedge funds, Derivatives, Structured Products
The current backdrop with heightened uncertainty over the length and intensity of the impact of the conflict and still-elevated positioning have increased the relevance of portfolio overlays to enhance the resilience of outcomes for investors. These range from liquid macro hedging instruments, options and derivatives and structured products with varied underlying assets and payoffs.
Investors must bear in mind that the objective of leaning into these instruments and additional investments during a period of significant uncertainty is not to eliminate risks entirely, but to reshape the portfolio outcomes by limiting drawdowns and retaining upside participation when the market recovers, which help investors to stay invested in core holdings or portfolios through market gyrations. This is a key feature of the type of portfolio decisions taken by professional hedge funds on a constant basis.
Hedges and derivatives entail premium outlays i.e. costs at the onset, hence considerations such as sizing and the time horizon for the hedges are key implementation decisions. Investors can combine hedges that involve payment of put premiums or selected structured product payoffs, e.g. yield enhancement structures or income strategies, to reduce the overall costs of protection as described in Exhibit 6.
Exhibit 6: Combining macro hedges, derivatives and structured products as portfolio overlays to augment the payoff profile of the whole portfolio (subject to client suitability and risk appetite)
|
Description |
|
|
Equity & Volatility Hedges |
|
|
Index options (Puts/Collars) |
Options on broad, liquid market indices such as the S&P 500, MSCI World etc. |
|
Volatility options |
Long equity volatility index e.g. VIX via ETFs, futures or put spread options |
|
Credit Hedges |
|
|
Credit Default Swap (CDS) indices |
CDS indices are tradable financial instruments that track a basket of single-name credit default swaps. Investors buy these indices to protect against widening credit spreads and rising default risks. |
|
Rates & Duration Hedges |
|
|
Government bond futures |
Buying or selling government bonds at predetermined price on a future date to hedge against interest rate and growth risks. Less effective under inflationary scenarios. |
|
Interest rate swaps/options |
To protect against unexpected and unfavourable shifts in interest rates, especially when there is a mismatch in asset and liability. |
|
Currency Hedges |
|
|
FX options |
To protect against unfavourable currency moves especially when there is a mismatch in asset and liability |
|
Structured Products |
|
|
FCNs, CLNs, autocallables, Worst-of options, reverse convertibles etc. |
Wide range of structured products that can be linked to indices, single security, multiple securities that aim to provide asymmetric risk-return profile while offering yield or suitable bull-bear or market-neutral payoffs. These can work well in sideways or moderately volatile markets but may be vulnerable during periods of very sharp drawdowns and extreme volatility. They also carry issuer and liquidity risks. |
Source: Bank of Singapore
Exhibit 7: Alternatives demonstrated significant portfolio stabilisation during 2022-2023
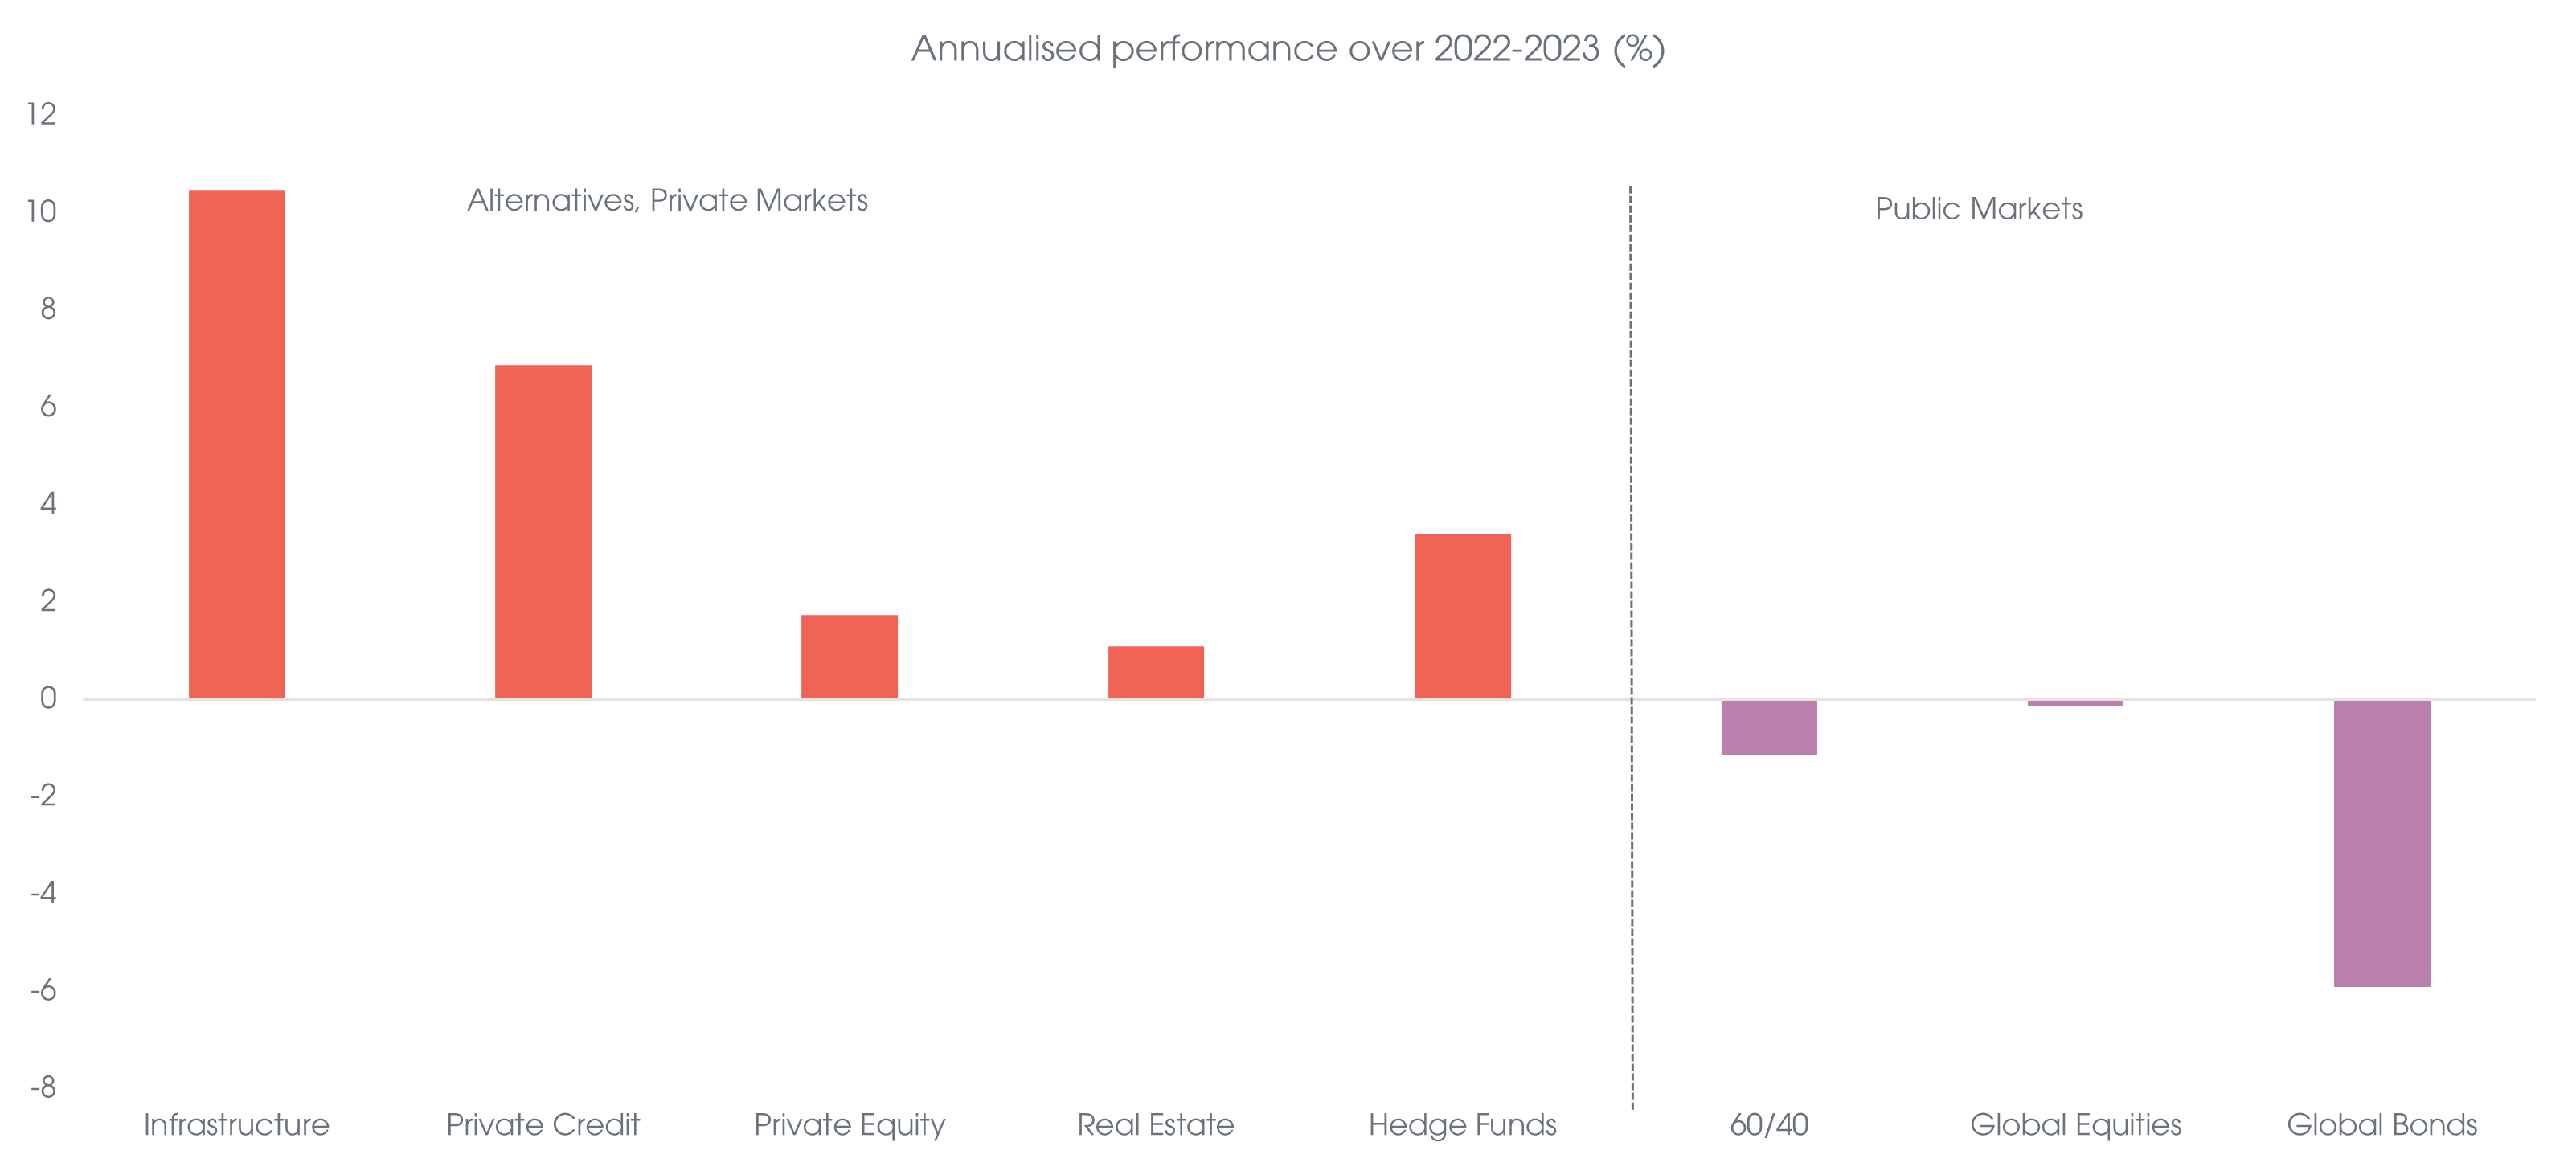
Source: Preqin, Bloomberg, Bank of Singapore
Alternatives provide a more structural form of diversification, with return drivers with lower correlation to traditional equity and duration exposures. In the context of oil supply shocks, their effectiveness depends on their sensitivity to inflation, rates and macro dispersion.
With the potential risks of a more stagflationary backdrop and tighter financial conditions, selected alternative investments can play the role of a more sustainable stabilising force within portfolios. This includes hedge funds, real assets and selective exposures in private credit. While the market dynamics differed in the last inflation shock over 2022-2023, infrastructure, private credit and hedge funds were the clear relative winners.
Conclusion
Oil supply shocks are not typical market disruptions. They transmit primarily through energy prices, inflation and costs, and their impact on portfolios depends on how these forces interact with growth and policy. The starting valuations of the equity market also matter. When valuations are elevated, the sensitivity to an inflation-driven shock increases, reinforcing the case for external hedges. When valuations are more moderate, equities themselves provide greater resilience.
The evidence shows that no single asset provides consistent protection: the following Exhibit 8 summarises conclusions from the paper. Real assets (including gold and oil) respond most directly to the shock, while fixed income, currencies and equities offer more conditional protection depending on the macro environment.
The current environment shares several features with past oil supply shocks, including upward pressure on energy prices and inflation alongside a gradual slowdown in growth; equity valuations are demanding. In this context, assets directly linked to the disruption, such as energy and, to a lesser extent, gold, are more likely to provide effective protection.
By contrast, the role of traditional hedges remains conditional. Nominal duration is less effective in the early phase of the shock, while inflation-linked instruments provide more direct exposure to rising prices. Within risk assets, resilience depends on sector and quality, with energy-linked and defensive segments better positioned. Currency behaviour remains dependent on policy and external balances, with recent USD strength reflecting near-term dynamics rather than a stable hedge profile.
These considerations suggest a more selective approach to hedging, combining exposures that address both the immediate inflation impulse and the evolving growth outlook.
Exhibit 8: Performance of asset classes after oil supply shocks
|
Asset Class |
Observed performance |
Hedge characteristics |
|
Government bonds |
Uneven performance across episodes |
Sensitive to the balance between inflation and growth |
|
Inflation-linked bonds |
More consistent than nominal bonds |
Direct exposure to realised and expected inflation |
|
Investment Grade credit |
More resilient than lower-quality credit |
Less exposed to spread widening; more defensive characteristics |
|
High Yield credit |
Greater drawdowns in adverse episodes |
Higher sensitivity to growth and risk sentiment |
|
Gold |
Solid average returns, stronger in severe episodes |
Positive skew and convexity in tail scenarios |
|
Oil |
Direct and immediate response |
Direct linkage to supply disruption |
|
Equities |
Uneven performance across episodes; outcomes vary with macro backdrop and starting conditions |
Sensitive to input costs, demand and starting valuations |
|
Equities |
Strong dispersion across sectors and styles |
Resilience driven by sector composition, pricing power and balance sheet strength |
|
Currencies |
No consistent pattern across episodes |
Dependent on macro conditions, energy exposure and policy responses |
|
Alternatives |
More stable performance in recent episodes |
Lower correlations to traditional asset classes |
|
Alternatives |
More resilient in inflationary environments |
Exposure to real assets and contractual or inflation-linked cash flows |
|
Alternatives |
Relative stability with limited duration exposure |
Less sensitive to duration |
Source: Bank of Singapore
Disclaimers and Disclosures
This material is prepared by Bank of Singapore Limited (Co Reg. No.: 197700866R) (the “Bank”) and is distributed in Singapore by the Bank.
This material does not provide individually tailored investment advice. This material has been prepared for and is intended for general circulation. The contents of this material does not take into account the specific investment objectives, investment experience, financial situation, or particular needs of any particular person. You should independently evaluate the contents of this material, and consider the suitability of any product discussed in this material, taking into account your own specific investment objectives, investment experience, financial situation and particular needs. If in doubt about the contents of this material or the suitability of any product discussed in this material, you should obtain independent financial advice from your own financial or other professional advisers, taking into account your specific investment objectives, investment experience, financial situation and particular needs, before making a commitment to purchase any product.
The Bank shall not be responsible or liable for any loss (whether direct, indirect or consequential) that may arise from, or in connection with, any use of or reliance on any information contained in or derived from this material, or any omission from this material, other than where such loss is caused solely by the Bank’s wilful default or gross negligence.
This material is not and should not be construed, by itself, as an offer or a solicitation to deal in any product or to enter into any legal relations. You should contact your own licensed representative directly if you are interested in buying or selling any product discussed in this material.
This material is not intended for distribution, publication or use by any person in any jurisdiction outside Singapore, Hong Kong or such other jurisdiction as the Bank may determine in its absolute discretion, where such distribution, publication or use would be contrary to applicable law or would subject the Bank or its related corporations, connected persons, associated persons or affiliates (collectively “Affiliates”) to any licensing, registration or other requirements in such jurisdiction.
The Bank and its Affiliates may have issued other reports, analyses, or other documents expressing views different from the contents of this material, and may provide other recommendations or make investment decisions that are contrary to the views expressed in this material, and all views expressed in all reports, analyses and documents are subject to change without notice. The Bank and its Affiliates reserve the right to act upon or use the contents of this material at any time, including before its publication.
The author of this material may have discussed the information or views contained in this material with others within or outside the Bank, and the author or such other Bank employees may have already acted on the basis of such information or views (including communicating such information or views to other customers of the Bank).
The Bank, its employees (including those with whom the author may have consulted in the preparation of this material))and discretionary accounts managed by the Bank may have long or short positions (including positions that may be different from or opposing to the views in this material or may be otherwise interested in any of the product(s) (including derivatives thereof) discussed in material, may have acquired such positions at prices and market conditions that are no longer available, may from time to time deal in such product(s) and may have interests different from or adverse to your interests.
Analyst Declaration
The analyst(s) who prepared this material certifies that the opinions contained herein accurately and exclusively reflect his or her views about the securities of the company(ies) and that he or she has taken reasonable care to maintain independence and objectivity in respect of the opinions herein.
The analyst(s) who prepared this material and his/her associates do not have financial interests in the company(ies). Financial interests refer to investments in securities, warrants and/or other derivatives. The analyst(s) receives compensation based on the overall revenues of Bank of Singapore Limited, and no part of his or her compensation was, is, or will be directly or indirectly related to the inclusion of specific recommendations or views in this material. The reporting line of the analyst(s) is separate from and independent of the business solicitation or marketing departments of Bank of Singapore Limited.
The analyst(s) and his/her associates confirm that they do not serve as directors or officers of the company(ies) and the company(ies)or other third parties have not provided or agreed to provide any compensation or other benefits to the analyst(s) in connection with this material.
An “associate” is defined as (i) the spouse, parent or step-parent, or any minor child (natural or adopted) or minor step-child, or any sibling or step-sibling of the analyst; (ii) the trustee of a trust of which the analyst, his spouse, parent or step-parent, minor child (natural or adopted) or minor step-child, or sibling or step-sibling is a beneficiary or discretionary object; or (iii) another person accustomed or obliged to act in accordance with the directions or instructions of the analyst.
Conflict of Interest Declaration
The Bank is a licensed bank regulated by the Monetary Authority of Singapore in Singapore. Bank of Singapore Limited, Hong Kong Branch (incorporated in Singapore with limited liability), is an Authorized Institution as defined in the Banking Ordinance of Hong Kong (Cap 155), regulated by the Hong Kong Monetary Authority in Hong Kong and a Registered Institution as defined in the Securities and Futures Ordinance of Hong Kong (Cap.571) regulated by the Securities and Futures Commission in Hong Kong. The Bank, its employees and discretionary accounts managed by its Singapore Office/Hong Kong Office may have long or short positions or may be otherwise interested in any of the investment products (including derivatives thereof) referred to in this document and may from time to time dispose of any such investment products. The Bank forms part of the OCBC Group (being for this purpose Oversea-Chinese Banking Corporation Limited (“OCBC Bank”) and its subsidiaries, related and affiliated companies). OCBC Group, their respective directors and/or employees (collectively “Related Persons”) may have interests in the investment products or the issuers mentioned herein. Such interests include effecting transactions in such investment products, and providing broking, investment banking and other financial services to such issuers. OCBC Group and its Related Persons may also be related to, and receive fees from, providers of such investment products. There may be conflicts of interest between OCBC Bank, the Bank, OCBC Investment Research Private Limited, OCBC Securities Private Limited or other members of the OCBC Group and any of the persons or entities mentioned in this report of which the Bank and its analyst(s) are not aware due to OCBC Bank’s Chinese Wall arrangement.
The Bank adheres to a group policy (as revised and updated from time to time) that provides how entities in the OCBC Group manage or eliminate any actual or potential conflicts of interest which may impact the impartiality of research reports issued by any research analyst in the OCBC Group.
Other Disclosures
Dubai International Financial Center (DIFC)
Where this material relates to structured products and bonds, this clause applies:
The Distributor represents and agrees that it has not offered and will not offer the product to any person in the Dubai International Financial Centre unless such offer is an “Exempt Offer” in accordance with the Market Rules of the Dubai Financial Services Authority (the “DFSA”).
The DFSA has no responsibility for reviewing or verifying any documents in connection with Exempt Offers.
The DFSA has not approved the Information Memorandum or taken steps to verify the information set out in it, and has no responsibility for it.
The product to which this document relates may be illiquid and/or subject to restrictions in respect of their resale. Prospective purchasers of the products offered should conduct their own due diligence on the products.
Please make sure that you understand the contents of the relevant offering documents (including but not limited to the Information Memorandum or Offering Circular) and the terms set out in this document. If you do not understand the contents of the relevant offering documents and the terms set out in this document, you should consult an authorised financial adviser as you deem necessary, before you decide whether or not to invest.
Where this material relates to a fund, this clause applies:
This Fund is not subject to any form of regulation or approval by the Dubai Financial Services Authority (“DFSA”). The DFSA has no responsibility for reviewing or verifying any Prospectus or other documents in connection with this Fund. Accordingly, the DFSA has not approved the Prospectus or any other associated documents nor taken any steps to verify the information set out in the Prospectus, and has no responsibility for it. The Units to which this Fund relates may be illiquid and/or subject to restrictions on their resale. Prospective purchasers should conduct their own due diligence on the Units. If you do not understand the contents of this document you should consult an authorized financial adviser. Please note that this offer is intended for only Professional Clients and is not directed at Retail Clients.
These are also available for inspection, during normal business hours, at the following location:
Bank of Singapore
Office 30-34 Level 28
Central Park Tower
DIFC, Dubai
U.A.E
Hong Kong
Bank of Singapore Limited (Hong Kong Branch) is an Authorized Institution as defined in the Banking Ordinance of Hong Kong (Cap 155), regulated by the Hong Kong Monetary Authority in Hong Kong and a Registered Institution as defined in the Securities and Futures Ordinance of Hong Kong (Cap.571). Financial products and services are only offered to “Professional Investors" within the meaning of the Securities and Futures Ordinance and the Securities and Futures (Professional Investor) Rules made thereunder.
This material has not been delivered for registration to the Registrar of Companies in Hong Kong and its contents have not been reviewed by any regulatory authority in Hong Kong. Accordingly: (i) the investment product may not be offered or sold in Hong Kong by means of any document other than to persons who are "Professional Investors" within the meaning of the Securities and Futures Ordinance (Cap. 571) of Hong Kong and the Securities and Futures (Professional Investor) Rules made thereunder or in other circumstances which do not result in the document being a "prospectus" within the meaning of the Companies (Winding Up and Miscellaneous Provisions) Ordinance (Cap. 32) of Hong Kong or which do not constitute an offer to the public within the meaning of the Companies (Winding Up and Miscellaneous Provisions) Ordinance; and (ii) no person may issue any invitation, advertisement or other material relating to the investment product whether in Hong Kong or elsewhere, which is directed at, or the contents of which are likely to be accessed or read by, the public in Hong Kong (except if permitted to do so under the securities laws of Hong Kong) other than with respect to the investment product which is or is intended to be disposed of only to persons outside Hong Kong or only to "Professional Investors" within the meaning of the Securities and Futures Ordinance and the Securities and Futures (Professional Investor) Rules made thereunder.
Where this material involves derivatives, do not invest in it unless you fully understand and are willing to assume the risks associated with it. If you have any doubt, you should seek independent professional financial, tax and/or legal advice as you deem necessary.
Where this material relates to a Complex Product, this clause applies:
Warning Statement and Information about Complex Product
(Applicable to accounts managed by Hong Kong Relationship Managers)
Where this material relates to a Complex Product (funds and ETFs), this clause applies additionally:
Where this material relates to a Complex Product (Options and its variants, Swap and its variants, Accumulator and its variants, Reverse Accumulator and its variants, Forwards), this clause applies additionally:
Where this material relates to a Loss Absorption Product, this clause applies:
Warning Statement and Information about Loss Absorption Products
(Applicable to accounts managed by Hong Kong Relationship Managers)
Before you invest in any Loss Absorption Product (as defined by the Hong Kong Monetary Authority), please read and ensure that you understand the features of a Loss Absorption Product, which may generally have the following features:
Where this material relates to a certificate of deposit, this clause applies:
A certificate of deposit is not a protected deposit and is not protected by the Deposit Protection Scheme in Hong Kong.
Where this material relates to a structured deposit, this clause applies:
A structured deposit is not a protected deposit and is not protected by the Deposit Protection Scheme in Hong Kong.
Where this material relates to a structured product, this clause applies:
This is a structured product which involves derivatives. Do not invest in it unless you fully understand and are willing to assume the risks associated with it. If you are in any doubt about the risks involved in the product, you may clarify with the intermediary or seek independent professional advice.
Singapore
Bank of Singapore Limited is a bank licensed and regulated by the Monetary Authority of Singapore. The Bank is also an Exempt Capital Markets Services Entity under the Securities and Futures Act 2001 and an Exempt Financial Adviser under the Financial Advisers Act 2001.
Where this material relates to structured deposits, this clause applies:
The product is a structured deposit. Structured deposits are not insured by the Singapore Deposit Insurance Corporation. Unlike traditional deposits, structured deposits have an investment element and returns may vary. You may wish to seek independent advice from a financial adviser before making a commitment to purchase this product. In the event that you choose not to seek independent advice from a financial adviser, you should carefully consider whether this product is suitable for you.
Where this material relates to dual currency investments, this clause applies:
The product is a dual currency investment. A dual currency investment product (“DCI”) is a derivative product or structured product with derivatives embedded in it. A DCI involves a currency option which confers on the deposit-taking institution the right to repay the principal sum at maturity in either the base or alternate currency. Part or all of the interest earned on this investment represents the premium on this option.
By purchasing this DCI, you are giving the issuer of this product the right to repay you at a future date in an alternate currency that is different from the currency in which your initial investment was made, regardless of whether you wish to be repaid in this currency at that time. DCIs are subject to foreign exchange fluctuations which may affect the return of your investment. Exchange controls may also be applicable to the currencies your investment is linked to. You may incur a loss on your principal sum in comparison with the base amount initially invested. You may wish to seek advice from a financial adviser before making a commitment to purchase this product. In the event that you choose not to seek advice from a financial adviser, you should carefully consider whether this product is suitable for you.
United Kingdom
Bank of Singapore Limited, UK Branch (BOSL UK) is incorporated and registered in Singapore with the Accounting and Corporate Regulatory Authority (Registration no.:197700866R) as a public company limited by shares with head office in Singapore and operating in the UK through its UK establishment (BR027666). Bank of Singapore Limited, UK branch (FRN: 1038970) is an appointed representative of Oversea-Chinese Banking Corporation Limited, London branch. Oversea-Chinese Banking Corporation Limited (OCBC) is authorised and regulated by the Monetary Authority of Singapore. OCBC London Branch is authorised by the Prudential Regulation Authority with firm reference number 204687 and subject to regulation by the Financial Conduct Authority and limited regulation by the Prudential Regulation Authority. Details about the extent of OCBC London Branch’s regulation by the Prudential Regulation Authority are available on request. This material is intended solely for the use of the designated recipients. Unauthorised access, use, or distribution is strictly prohibited. If you are not the intended recipient, please notify us immediately and erase all copies. Bank of Singapore Limited, UK Branch does not provide legal, accounting or tax advice. Please consult an independent professional for advice tailored to your specific situation.
This product or service is offered exclusively for investors eligible for categorisation as a professional client. This is not intended for retail clients. Any person in the UK who receives this material is deemed to have represented and agreed that they qualify as a Professional Client. Such recipients also represent and agree that they have not received this material on behalf of any persons in the UK other than Professional Clients for whom they have authority to make investment decisions on a wholly discretionary basis. BOSL UK will rely on the truth and accuracy of these representations and agreements. Any person who is not a Professional Client should neither act on nor rely upon this material or any of its contents.
Investing in financial markets carries the risk of losing capital, and investors should be aware of and carefully consider this risk before making any investment decisions. The value of investments can fluctuate, and there is no guarantee that investors will recoup their initial investment. Past performance is not indicative of future results, and the performance of investments can be affected by various factors, including but not limited to market conditions, economic factors, and changes in regulations or tax laws. Forward-looking statements should not be considered as guarantees or predictions of future events. Investors should be prepared for the possibility of losing all or a portion of their invested capital. It is recommended that investors seek professional advice and conduct thorough research before making any investment decisions. BOSL UK does not endorse any specific investments or financial products mentioned in this material. Neither BOSL UK nor its employees accept any liability for any loss or damage arising from the use of this material or reliance on its content.
Cross Border Disclaimer and Disclosures
Refer to https://www.bankofsingapore.com/Disclaimers_and_Disclosures.html for cross-border marketing disclaimers and disclosures.
ESG Disclaimer
This document contains information on ESG factors or the Bank’s process for taking into consideration, and evaluation or assessment of ESG factors.
There are currently no universally accepted environmental, social and governance (“ESG”) standards, and no consensus as to whether activities and practices or products or services are “environmentally friendly”, “sustainable”, “responsible”, “climate friendly”, etc. Evaluation of ESG outcomes or metrics may require forward-looking scenario analysis, estimates, interpretations and assumptions and may be uncertain and speculative. There may not be scientific consensus. Scientific evidence and data may not be conclusive or there may be limitations, and new evidence and data may be emerging. ESG standards may depend on subjective or value judgments. ESG standards, as well as laws, rules and regulations may differ from jurisdiction to jurisdiction. Taxonomies have been developed in different jurisdictions to classify activities as “environmentally sustainable”, “green” or the equivalent, and different taxonomies may classify the same activity differently. Achieving one ESG goal may be at the expense of, or require a compromise on, other ESG goals. The Bank’s ESG standards and evaluation or assessment of ESG factors may therefore not meet your expectations or objectives and may not be consistent with certain ESG laws, rules, regulations and standards. There is no guarantee that there will not be negative ESG outcomes, and the Bank does not give any assurance that your investments will have a positive ESG impact. You should ensure that you understand the Bank’s ESG standards and process for evaluation or assessment of ESG factors, and assess whether the Bank’s ESG standards and process for evaluation or assessment of ESG factors meets your expectations or is appropriate for you, before making any investment commitment. You are solely responsible for your own investment decisions.
The Bank relies on third party ESG ratings. While the Bank has selected its third party ESG rating providers in good faith and with reasonable care, the Bank has not independently verified the ESG ratings of third party providers. The Bank gives no representation or warranty, express or implied, as to the quality, accuracy, completeness, rigour, timeliness or verifiability of such third party ESG ratings, and shall not be responsible or liable for such third party ESG ratings. ESG ratings may be based on data that is incomplete, due to limitations or otherwise, or based on commitments and targets which may not be achieved. You should review and understand the disclosures made by such third party ESG ratings providers on their methodologies, data sources and other relevant information, and obtain advice from professional advisers as necessary.
Taking into consideration ESG factors may be at the expense of higher financial returns, especially in the short term. Although ESG risks may result in financial losses, such losses may, and if at all, only materialise in the long term. ESG factors and screening may also result in certain investments that deliver high financial returns being excluded, or limit the diversity of investments, which could in turn affect the volatility of portfolios.